Frequency Response Testing of amplifiers, February
2013.
During construction of any amplifier, there is always a need to
plot the frequency response
graph and to examine the stability with transient input signals.
What is always wanted is that
all power amplifiers have a flat frequency response between at
least 20Hz to 30kHz with no
more than -1dB attenuation across this range, and we wish that the
response below or above
this range has no peaks exceeding +3dB, regardless of the load
which may be any
possible pure resistance, or with any possible combination of R
plus inductance L or
capacitance C. All amplifiers must be able to remain
unconditionally stable
( free of any oscillations ) even without any load connected at
all.
To achieve the response and stability required, we need to have
suitable test equipment
including the following items :-
1, Sine wave signal source from 2Hz to 200kHz with THD < 0.5%,
with up to 3Vrms amplitude.
2, Square wave signal source for at least 4 frequencies between
100Hz to 500kHz, and
preferably with 12 frequencies, and 3 F per decade and with rise
time of at least 50V/uS.
3, Wide bandwidth Vac volt meters for measuring of large voltages
between 1Vrms
and 500Vrms, with medium accuracy for F between 2Hz and 2MHz.
4, Wide bandwidth Vac volt meters for measuring voltages between
1mVrms and 1,000Vrms
between F 2Hz to 2MHz with high accuracy. I have several analog
Vac meters for measuring
anode voltages and other high level signals over a wide range of
F.
I do have several digital meters which are accurate for Vac up to
only 1kHz.
5, Radio variable 2 gang tuning capacitor giving C between 50pF
and 800pF, and combined
with good quality 25k linear potentiometer in series to make a
Zobel network that can have
its R and C varied while observations are made with oscilloscope
and
with square wave.
6, Analog old style oscilloscope ( aka Cathode Ray Oscilloscope,
CRO ), with 2Hz to 2MHz
bandwidth. Preferably a dual trace unit capable of DC to 15MHz is
used.
7, A variable dummy resistance load capable of full power testing
for several minutes.
R load values should be selectable between 1, 2, 3, 4, 5, 6, 7, 8,
10, 12, 14, 16 ohms,
and possibly more ohms up to 32 ohms by adding yet more series
connected high watt R.
8, Capacitor loads need only be rated to take the expected
amplifier voltages. They normally
do not heat up when subjected to considerable signal voltage, but
the amplifier will heat up
due to current flow.
9. Power amp speaker cables with low resistance. 15 amp rated
mains cabling is fine,
with 4mm banana plugs each end to connect from amp to dummy loads
fitted with 4mm
banana sockets.
10, Interconnect RCA cabling of normal high C of say 100pF and 1
metre long plus others
500mm long with less than 20pF.
What makes a useful sine wave and square wave generator? Usually,
many people use
what is called a function generator which puts out sine waves,
square waves, triangular
waves and has such extra abilities as AM and FM and variable
square wave intervals
between even spaced +/- waves peaks, and has DC offset adjustment.
In fact, only sine
and square waves are needed. Low distortion in sine waves is not
critically important for
response measuring as it is when measuring THD, so anything with
THD < 0.5% is OK.
Square waves need only a rise time of 50V/uS with no benefits of
having say 500V/uS.
Signal generators should have maximum output resistance of 600
ohms to ensure the input
resistance of amplifiers has little effect on the output level of
the signal generator.
I am presently using a sine/square gene with 1.8k potentiometer at
its output which means
its maximum approximate Rout = 600 ohms and surprisingly, with a
normal high capacitance
RCA cabling to my CRO, there is considerable reduction of rise
time of square waves.
But at least all F up to 500kHz are unattenuated from the gene.
Better signal genies have Rout = 50 ohms, which means the gene
would need to have
a buffered output using a pair of complementary npn and pnp source
follower mosfets after
the attenuator pot inside the sig gene. But unless otherwise
stated, assume all measurements
are done with sig gene of Rout < 600 ohms. To make a graph of F
response between say
1Hz and 1MHz, one can use the oscilloscope ( CRO ) as a volt
meter. Suppose you have a
32W amp which makes a maximum Vo = 16.0Vrms into 8r0. The response
with a pure
8r0 load can be examined with the amp running at 16Vrms at 1kHz
and the trace on the
CRO is set so peak to peak waves occupy 1/2 the screen height, and
centered. If the Vo
increases by +6dB the sine wave will occupy the whole screen
height, and if -6dB it occupies
1/4 of the screen height. This method will show small Vo changes
of only +/-1dB, when
Vo will be 1.12 x 16Vrms or 0.89 x 16Vrms. A scale drawn on
masking tape may be put
on each side of the screen to offer logarithmic calibration so you
know levels of
+/-3dB, +/-6dB, -9dB, -12dB. Practice with the CRO stops your
confusion. The CRO
should have 10MHz BW, and for best LF Vo measurement, always use
the DC option
on switch for DC or AC. The amp secondary winding on OPT should
have one end taken to 0V.
To record your measured response with sine waves at the
frequencies produced by oscillators
below, you can make a printed paper copy of a response sheet then
plot Vo levels with a pencil.
Clever Dicks among you will use a PC program but usually they are
limited to 20Hz to
20kHz, and you NEED to measure a much wider response. Here is a
sample response sheet
which you may copy....
Graph 1. Blank sheet for F response recording.
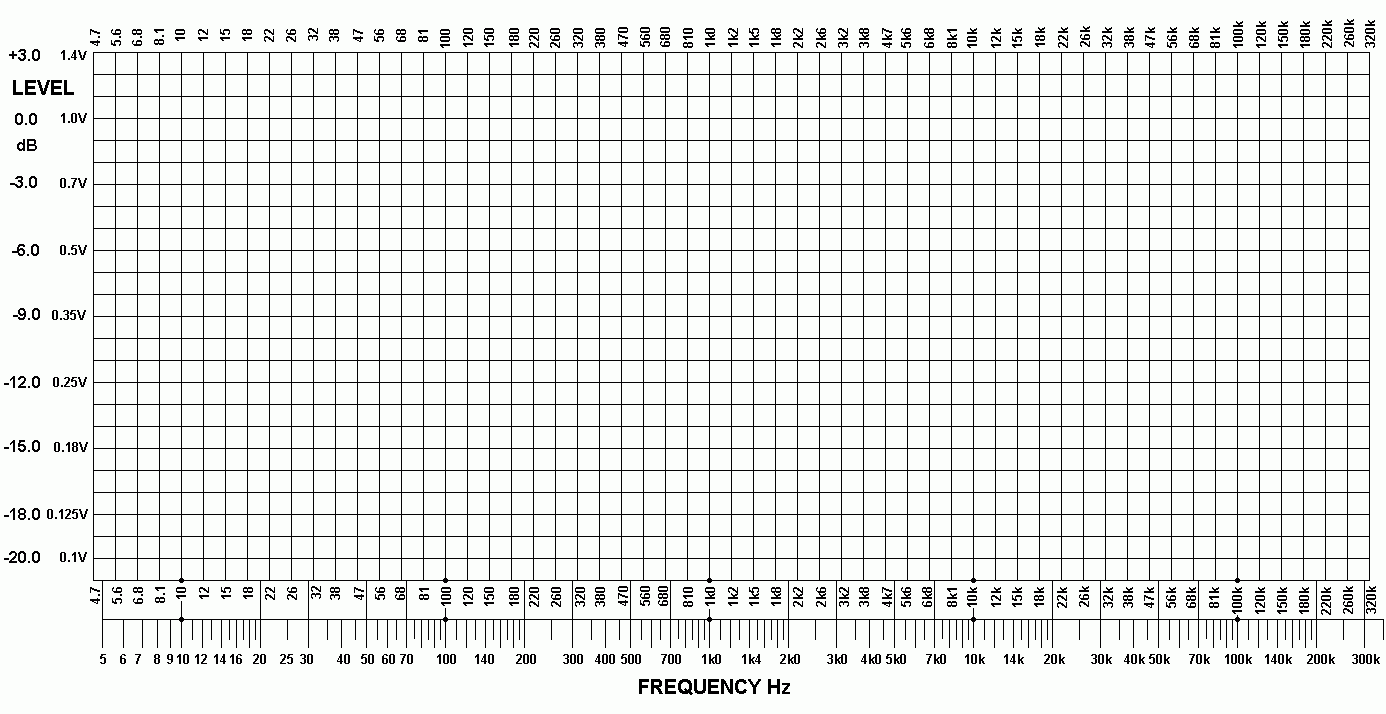
This may be extended at left side down to 1Hz or raised on right
side to 1Mhz,
and I leave YOU to decide how big you want it to be a printed A4
page.
Once you get the page you want, many copies can be made. I spent
many hours getting
the logarithmic scales just right as I could. One sig gene I have
has same switched F
output as the vertically written numbers 4.7, 5.6, etc. The
spacing is even along the logarithmic
scale. Once a row of dots have been penned on the graph sheet,
just join the dots with
a smooth curve where response changes, and you have a very good
idea of the response.
Measuring the response can tell you all about your mistakes. It is
hard disciplined work to
properly measure an amplifier. Response levels should be measured
at 0dB, which would
be 16Vrms for a 32W amp with 8r0 load, and then at -6dB = 8Vrms
and at -12dB = 4Vrms.
The best indication of stability and HF and LF behaviour and
especially with pure C loads
between 0.1uF and 2uF is done at the -12dB level where it will be
safe to test up to 100kHz
with 2uF connected, and where this 2uF has Z = 0.8r, which is
nearly a short circuit.
Don't test at 0dB with 2uF. Don't leave the amp running for long
at high Po when testing below
20Hz and there is distortion caused by OPT core saturation. The
response you wish to
understand is that where THD < 2%, which you can see on the CRO
as sudden appearance
of very distorted waves due to core saturation at LF, or
appearance of triangular waves at HF
known as slew rate distortion, ie, some stage in the amp becomes
overloaded at HF.
Therefore you may find the response for Vo = 0dB may have -3dB
poles at
F1 = 20Hz, F2 = 40kHz. But at Vo = -6dB, F1 = 12Hz, F2 = 80kHz,
and at Vo = -12dB,
F1 = 5Hz, F2 = 60kHz.
There will always be peaks in the response at LF if the open loop
phase shift is high and you
have not used LF gain shelving. Similarly, peaked response occurs
with a pure C load usually
above 15kHz. and to minimize the peaking there must be zobel
networks applied carefully within
the amp. The idea is to get the widest 0dB response with a pure R
load which is the correct load
for the amp, yet not have peaking any more than +3dB at any F
regardless of pure C load use.
The response with zero load at all should not be measured above
the 0dB Vo reference level
for the R load. It can be measured at any level below 0dB. The amp
open loop gain is highest
when there is no load connected. While there may be say 16dB GNFB
connected when an
8r0 load is used, this amount of GNFB depends on the open loop
gain, ie, Vo divided by
Vin without any GNFB connected. Without any load, many tube amps
oscillate at LF
because their open loop gain of the output tubes has perhaps
doubled which increases
the amount of GNFB applied which may make the amp work at a level
above the "margin of stability".
This margin of stability is expressed in dB, and it means the amp
becomes unstable if the
amount of NFB is increased from the safe level by a certain number
of dB. In a real amp
with 16dB of GNFB, it may begin to oscillate if GNFB is increased
by say 8dB to 24dB.
So the margin of stability = 8dB, and you just can't allow GNFB to
ever be 24dB, even
when the amp is unloaded. It means that you have to apply the gain
shelving networks
just right because the margin of stability is exceeded first where
there are peaks in the
sine wave response below 20Hz and above 20kHz. The best amps I
built has 15dB GNFB
which could be increased to 35dB before oscillations could not be
prevented by R&C networks
for reductions of open loop gain and phase shift below and above
the audio band where the
applied GNFB should effectively be reduced because the open loop
gain has been reduced.
You do NOT want a high amount of GNFB applied at 10Hz or 100kHz.
Some years ago I
built a signal gene with switched sine wave F and switched square
wave F.
Fig 1. Wien bridge oscillator with oppamp.
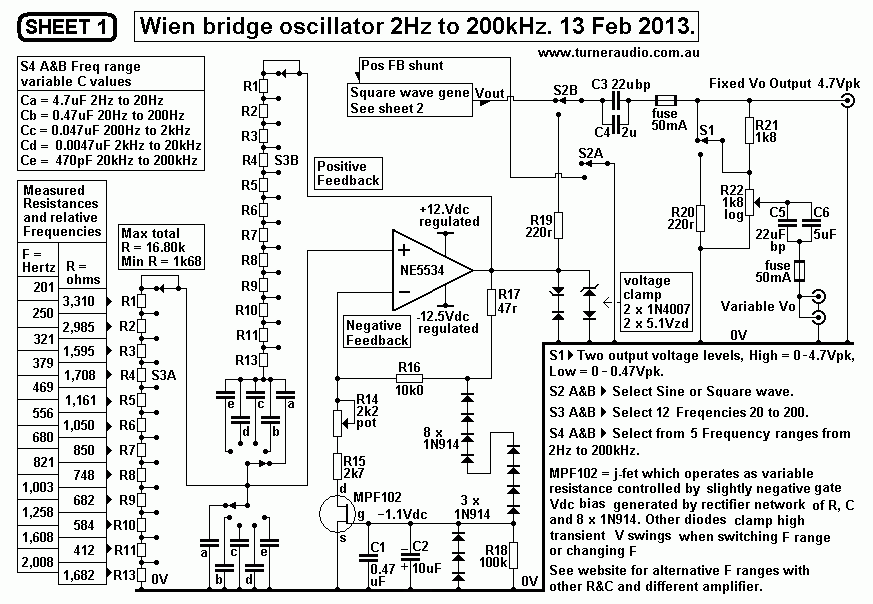
Fig 2. Square wave generator with discrete bjt to make
op-amp.
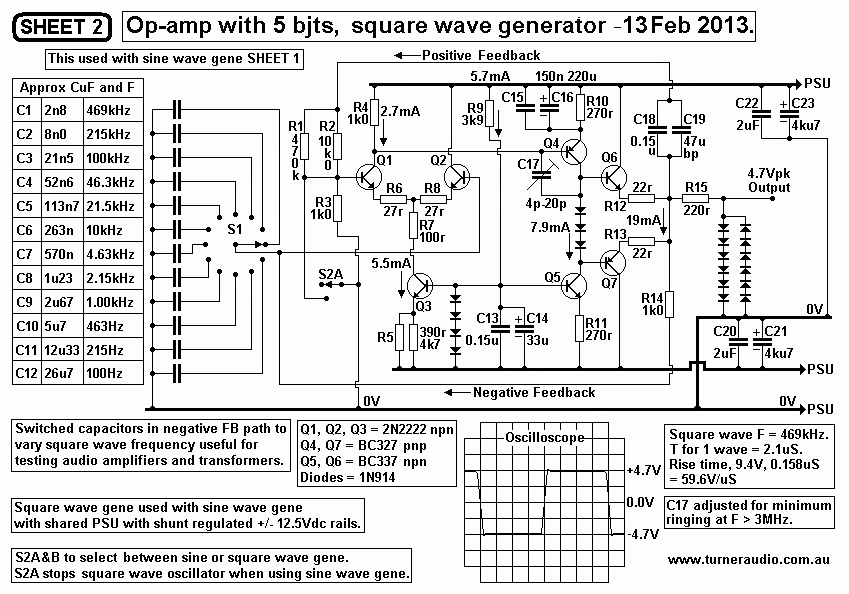
Fig 3. Wien bridge oscillator with discrete bjts to make
op-amp.
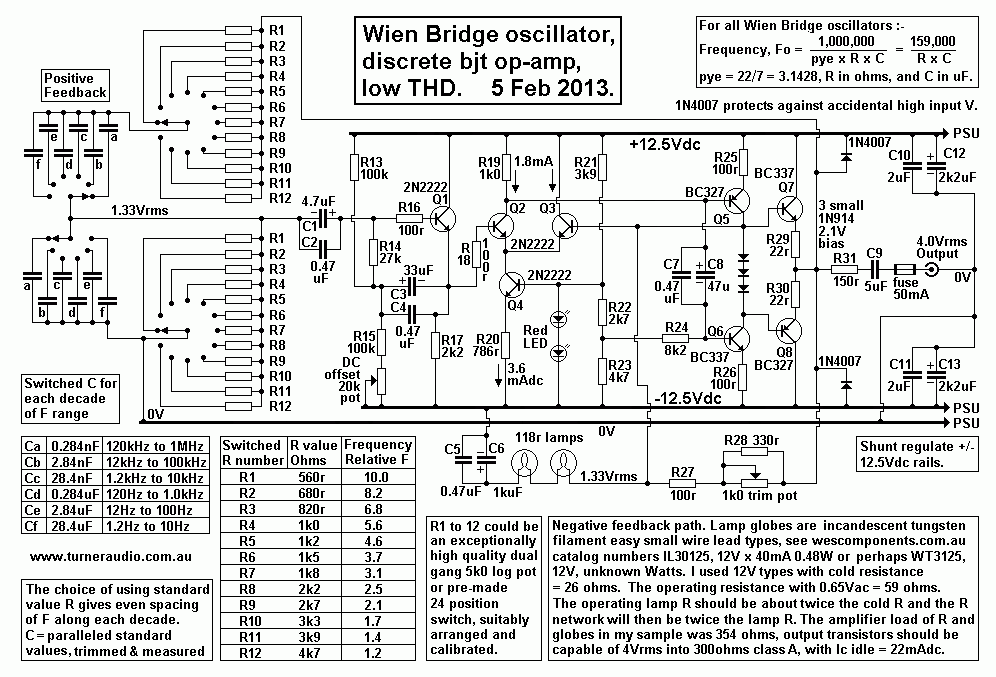
Fig 3 above is another example of a wien bridge sine wave gene.
Back to Education and DIY
directory.
Back to Index